
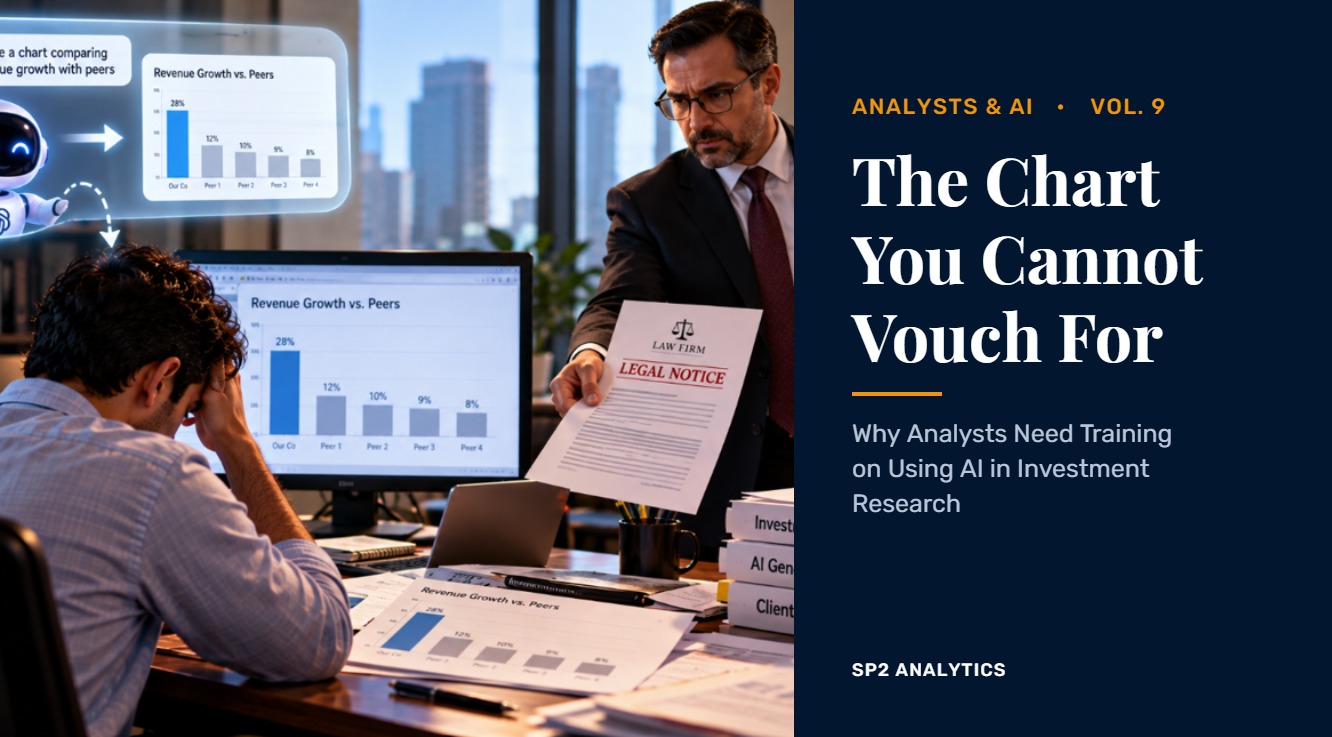
Ask any AI tool today for a slide comparing a company’s revenue growth with its peers, and you will have a neat chart sitting in PowerPoint in under a minute. Right colours, clean axis, a confident title on top.
Now ask the analyst who put that slide in the report one simple question: where did the number in the third bar come from?
If the answer is “the AI made it”, you do not have a chart. You have a liability with your name on it.
In earlier volumes, we covered hallucinations, the Doorman Fallacy, and AI slop. All of them were about what AI gets wrong. This volume is about something more practical and closer to the daily desk: the gap is no longer in the tool. The gap is in how the person using the tool has been trained to use it.
The Shortcut That Looks Like Efficiency
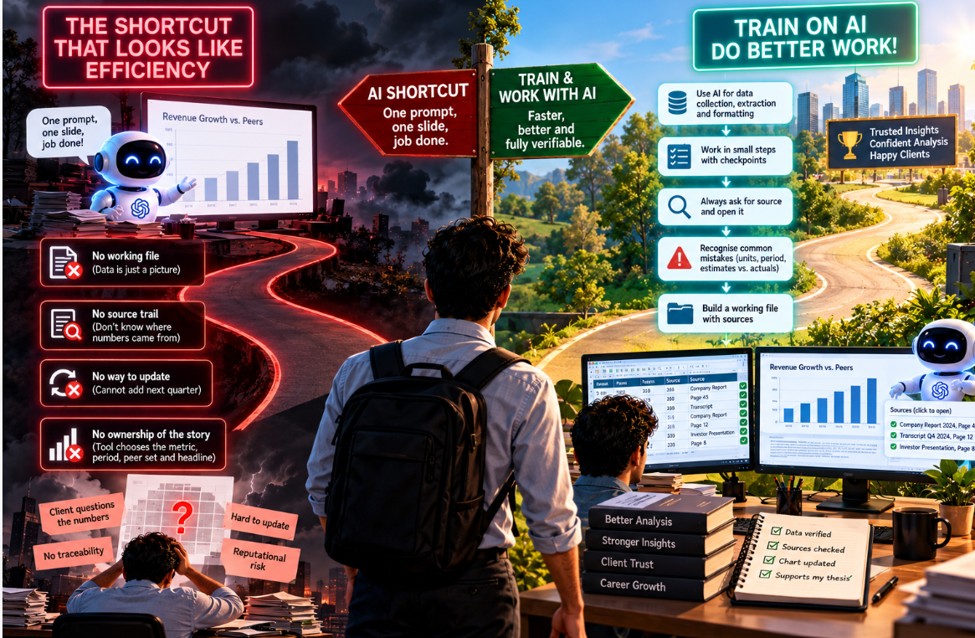
Letting AI create the chart directly in PowerPoint feels like the efficient thing to do. One prompt, one slide, job done. But look at what you are actually left with:
- No working file. The data sits inside a picture. There is no Excel behind it that you, your senior, or your client can open and check.
- No source trail. You do not know which filing, which page, or which period each number was taken from, or whether it was taken from anywhere at all.
- No way to update it. Next quarter, you cannot add one more data point. You have to start again and hope the tool gives you the same base numbers.
- No ownership of the story. The tool chose the metric, the time period, the peer set, and the headline. You only approved it.
That last point is the one most people miss. The chart is not just data. It is an argument. And in this workflow, the analyst did not make the argument, the tool did.
The Right Way: Excel First, Story Second
In Audit, you do not sign off on a number until you have traced it back to the document it came from. Research is no different. The right process:
- Gather the data in Excel. Use AI to locate the filings, extract the tables, and speed up the collection. This is where the tool saves you hours. But the numbers land in your sheet, not directly in a slide.
- Note the source against every data point. Document name, page or section, period, and link. If a number has no source, it does not stay in the sheet.
- Check a sample against the original. AI extraction is fast, not perfect. Units, currencies, restated figures, and fiscal year-ends are exactly where it slips.
- Build the chart from your own data. Now the chart has a file behind it. It can be audited, updated next quarter, and handed over to a colleague.
It takes a little longer than a single prompt. But the output is something you can vouch for, line by line, when the client calls and asks.
The Analyst Should Always Decide the Story, Not the Tool
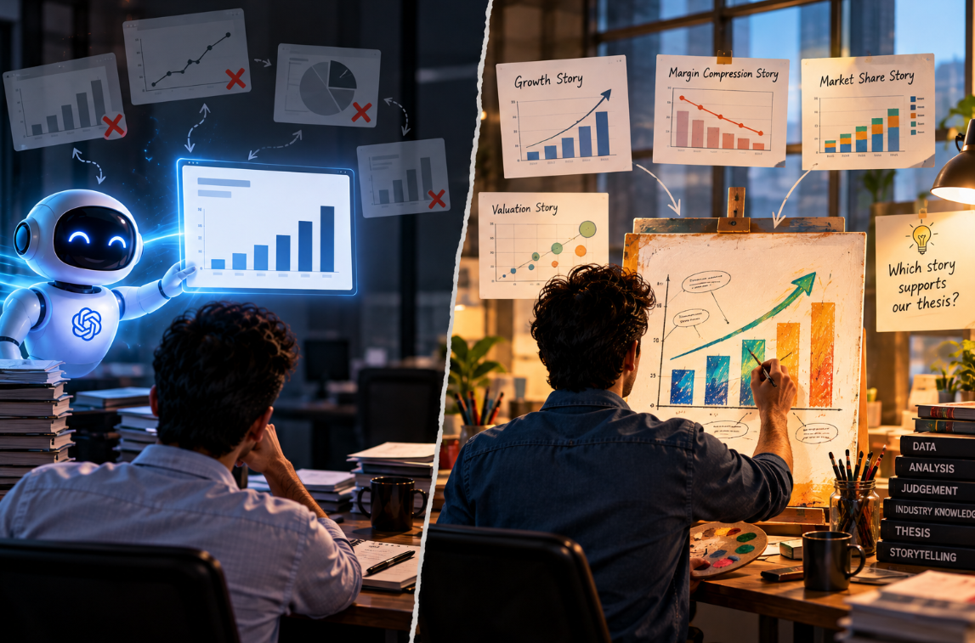
The same data set can tell very different stories. Five years of revenue and margin data can be presented as a growth story, a margin compression story, or a market share story, depending on what you put on the axis and which years you include.
When the data is sitting in your own Excel, you can see all of these options and pick the one that actually supports your thesis. You may even find that the data does not support your thesis at all, which is the most valuable finding of the lot.
When AI builds the chart directly, that choice is made for you, silently. You get one view of the data and no visibility on what was left out. An analyst who has not gathered the data himself is in no position to decide what story it should convey.
AI Is a Tool, Accountability Is Not Transferable
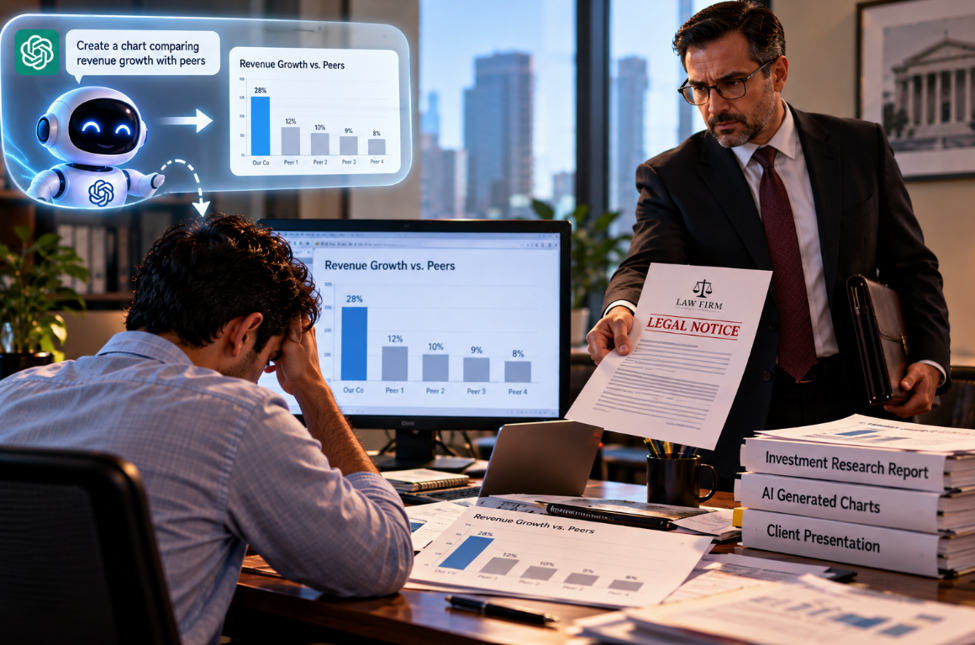
This is the point I want to emphasise the most. AI in investment research is still a tool to increase efficiency. It is a very powerful one, and I am fully in favour of using it. But a tool does not take responsibility for the work. The person handling it does.
Your client does not care which model produced the number. If it is wrong, it is your report, your firm’s name, and your credibility.
So the analyst has to design a process where he can take accountability for every data point in his research work. That is not possible if he does not understand how the tool behaves, where it is strong, and where it quietly fails.
What Training on AI Actually Means
When I say analysts need training on AI, I do not mean a two-hour session on writing prompts. I mean training on how to handle and manoeuvre around the tool to get the best out of it:
- Know what to hand over and what to keep. Data collection, extraction, formatting, and first drafts can go to the tool. The thesis, the story, and the final sign-off stay with the analyst.
- Break the work into steps. One big prompt gives one unverifiable output. Small steps give you a checkpoint after each one.
- Always ask for the source, then open it. A citation you have not opened is not a citation.
- Recognise the failure patterns. Mixed-up units, numbers from the wrong period, estimates presented as reported figures, and confident answers where data does not exist.
- Build the audit trail as you go. A working file with sources is part of the deliverable, not an afterthought once the report is done.
An untrained analyst with a powerful AI tool produces more output, faster, with less control over it. A trained analyst produces more output, faster, and can stand behind all of it. The tool is the same. The training makes the difference.
How SP2 Analytics Can Help
This is exactly where SP2 Analytics can help you.
We provide qualified offshore analysts, CAs, CFAs, and MBA Finance professionals, who already have the domain expertise in finance and accounts, and who are trained well to work on AI tools. They use AI to move faster, and they follow a process where data is gathered, sourced, and checked before it becomes a part of your report.
So you get the efficiency of AI, with an analyst who can take accountability for the work and answer the question, “where did this number come from?”
Sample reports and presentations from our analysts: https://sp2analytics.com/sample-work/
The Bottom Line
AI is not the risk in investment research. An untrained hand on the tool is.
Let AI do the heavy lifting on gathering and processing. Keep the data in a form you can vouch for. Let the analyst decide the story. And make sure the person using the tool is trained enough to get the best out of it and to own what comes out.
The firms that invest in training their analysts on AI will get the speed and keep the trust. The firms that only invest in the tools will get the speed and, sooner or later, a chart that nobody can explain.
What Is Your Take?
Is your team creating charts and tables directly from AI tools, or building them from a sourced data file? Has your firm given any formal training to analysts on how to use AI in research work? If you are a decision maker, do you ask for the backup file behind the report?
I would love to hear your perspective, the wins and the frustrations.
This post is published by CA Siddhartha Dongre, founder of SP2 Analytics.
SP2 Analytics provides qualified offshore research analysts (CAs, CFAs, MBA Finance) to investment banks, PE firms, VC funds, equity research shops, and consulting companies worldwide. www.sp2analytics.com
If you need skilled analysts who are trained to work with AI tools, let us talk.
Email: sid.dongre@sp2analytics.com | LinkedIn: CA Siddhartha Dongre
#SP2Analytics #investmentresearch #equity #equityresearch #investmentbanking #privateequity #AI #AIforfinance #AItraining #analysttraining #humanintheloop #accountability #offshoreanalysts #CA #CFA #AnalystsAndAI